Sign In
A complete visual history of every account — every action, every response, every moment.
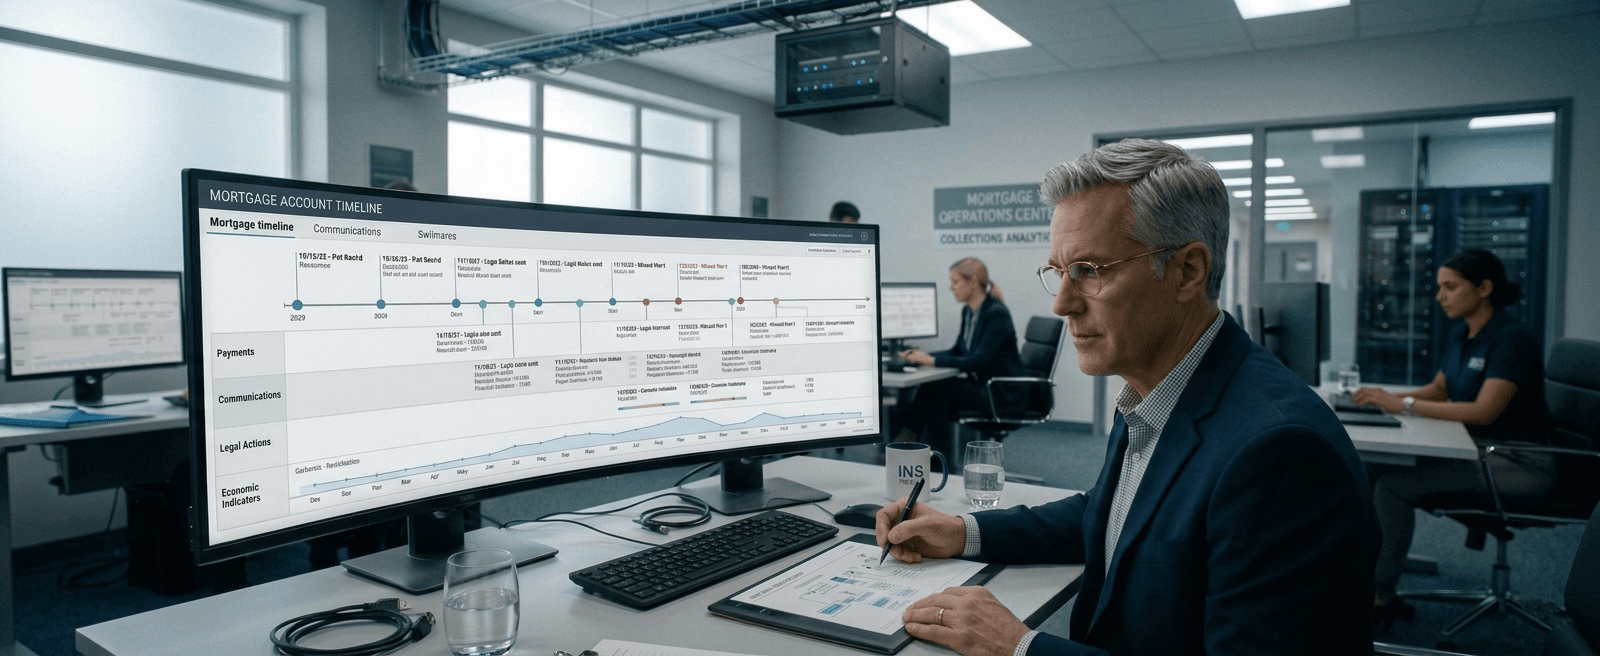
A timeline graph in the context of accounts receivable and collections is a chronological visual representation of every event associated with a specific account — including invoice issuance, payment due dates, outreach attempts, responses received, escalations triggered, and payments made or missed. Unlike a static account ledger, acollections timeline graph presents the full interaction historyin a format that allows a collections analyst or manager to understand the account's behaviour and the team's response at a glance, without interrogating multiple data sources. In acollections management platform, the timeline graph serves as both an operational tool — enabling real-time decision-making — and an audit record — providing evidence of the actions taken and the sequence in which they occurred. The ability to see the full account history in a single view is particularly important in regulated industries where the timing, frequency, and content of collections communications are subject to strict legal requirements. A well-implemented timeline graph removes the information asymmetry that slows escalation decisions and increases the risk of compliance errors in high-volume collections operations.
Without a timeline graphor equivalent account history visualisation, collections teams operating at scale are forced to reconstruct account history from multiple systems — a process that is time-consuming, error-prone, and inconsistent across team members. The decision quality of a collections specialist who can see a complete interaction timeline in seconds is materially higher than one working from fragmented records — and the risk of regulatory non-compliance is materially lower when every communication action is logged, timestamped, and visible. In organisations subject to FDCPA, Regulation-F, andCFPB supervision, the timeline graph functions as a compliance defence — providing contemporaneous evidence of what was done, when, and in what sequence, if a consumer dispute or regulatory inquiry arises. The operational cost of investigating a disputed account without a timeline record — recreating history from call logs, email servers, and manual notes — is consistently high and frequently inconclusive. Investing in timeline visibility is not a reporting enhancement — it is a risk management requirement for any collections operation operating at scale in a regulated environment.
Operational Scenario: A regional mortgage servicer managing approximately 42,000 active loan accounts received a consumer complaint alleging that its collections department had contacted the borrower more than seven times within a seven-day period — a direct violation of the contact frequency limitation introduced by Regulation-F. Without atimeline graph recording every outreach event with timestamps, channel data, and agent identifiers in a single accessible view, the servicer was unable to produce contemporaneous evidence of its contact frequency within the regulatory response window. The servicer was required to treat the complaint as a confirmed violation, triggering a CFPB inquiry and a full audit of contact cadence across all delinquent accounts in the portfolio. Following the inquiry, the servicer implemented a collections platform with a fully integrated account timeline graphrecording every event automatically at the point of execution. The next similar complaint — received four months later — was resolved in under three hours using the timeline as documentary evidence, and the complaint was closed without regulatory escalation.
Interaction History — the complete record of every communication, payment event, and system action associated with an account.